
UPDATE: This article has now been published in Weed Technology. The open access, formatted and copy-edited article is available here:
Abstract.
A meta-analysis of 11 previously published field studies was conducted with the objectives to 1) estimate the no observable effects dose (NOED) for dicamba on susceptible soybean; 2) evaluate available evidence for hormesis, or increased soybean yield in response to low doses of dicamba; 3) estimate the dose of dicamba likely to cause measurable soybean yield loss under field conditions; and 4) quantify the relationship between visible injury symptoms and soybean yield loss. All studies that included visible injury data (N=7) reported injury symptoms at the lowest non-zero dicamba dose applied (as low as 0.03 g ha-1), and therefore a no observable effects dose (NOED) could not be estimated from the existing peer-reviewed literature. Based on statistical tests for hormesis, there is insufficient evidence to support any claim of increased soybean yield at low dicamba doses. Future research should include a range of dicamba doses lower than 0.03 g ha-1 to estimate a NOED and to determine whether a hormesis effect is possible at or below dicamba doses that cause visible injury symptoms. Soybean is more susceptible to dicamba when exposed at flowering (R1 to R2 stage) compared to vegetative stages (V1 to V7). A dicamba dose of 0.9 g ha-1 (95% CI = 0.08 to 1.7) at the flowering stage was estimated to cause 5% soybean yield loss. When exposed at vegetative stages, dicamba doses that cause less than 30% visible injury symptoms (95% CI = 23 to 49%) appear unlikely to cause greater than 5% soybean yield loss; however, if exposed at flowering, visible injury symptoms greater than 12% (95% CI = 8 to 16%) are likely to be associated with at least 5% soybean yield loss.
Nomenclature: Dicamba; soybean, Glycine max (L.) Merr.
Key Words: Non-target impacts, herbicide drift, crop injury.
Introduction
Dicamba-resistant soybean cultivars have recently been commercialized, and adoption of this genetically engineered trait has been widespread throughout soybean-growing regions of the United States. Along with the commercial introduction of these cultivars, there have been numerous reports of soybean fields without the dicamba-resistance trait showing synthetic auxin-herbicide symptoms. Extension personnel from soybean-producing states have estimated over 1.4 million hectares of soybean were damaged in 2017 (Bradley 2017), which represents approximately 4% of the 35 million hectares of soybean planted in 2017 (USDA-NASS 2017).
Synthetic auxin-herbicide injury on soybean is very distinctive, and dicamba rates as low as 0.03 g ha-1 can cause visible injury symptoms (Solomon and Bradley 2014). Many studies have been conducted to quantify the relationship between dicamba dose and soybean response. Egan et al. (2014) previously conducted a meta-analysis of published research in order to better quantify the response of soybean and cotton to 2,4-D and dicamba. Meta-analyses can be valuable, as they allow a more robust estimation of the potential yield impacts due to herbicide exposure than could be produced by any single study. Since Egan et al.’s meta-analysis, additional studies have been published reporting the effects of dicamba on soybean yield. These new studies provide additional exposure timings and dicamba doses compared to the studies analyzed by Egan et al. (2014). Therefore, the purpose of this report is to update the meta-analysis by Egan et al. (2014), and to add potentially useful information regarding the relationship of visible injury symptoms to soybean yield loss based on the new data that has been published in the last several years.
The objectives of this meta-analysis were to 1) estimate the no observable effects dose (NOED) for dicamba on susceptible soybean; 2) evaluate available evidence for hormesis, or increased soybean yield in response to low doses of dicamba; 3) estimate the dose of dicamba likely to cause measurable soybean yield loss under field conditions; and 4) quantify the relationship between visible injury symptoms and soybean yield loss.
Materials & Methods
In order to find relevant studies for inclusion in this meta-analysis, all studies cited by the Egan et al. (2014) meta-analysis were located. Additionally, the Web of Science and AGRICOLA databases were searched using the terms “dicamba” and “soybean” for papers published since 2012. All resulting papers (N=70) were then screened for the following inclusion criteria: 1) the study reported soybean yield data in response to dicamba treatment from a replicated field study; 2) the study included a zero-dose (non-treated control); and 3) the study included at least 3 dicamba doses greater than zero. Eleven studies met all three criteria for inclusion in the meta-analysis, five of which were not included in the original Egan et al. meta-analysis (Table 1).
Table 1. Information about studies included in the meta-analysis.
|
Study |
Number of dose-response series |
Number of soybean growth stages exposed |
Number of non-zero dicamba doses used |
Dicamba dose range (g ha-1) |
|
Al-Khatib and Peterson (1999)a |
2 |
1 |
4 |
5.6 to 187 |
|
Anderson et al. (2004)a |
2 |
1 |
3 |
5.6 to 56 |
|
Auch and Arnold (1978)a |
6 |
4 |
3 |
1 to 56 |
|
Griffin et al. (2013)b |
2 |
2 |
9 |
1.1 to 280 |
|
Huang et al. (2016)b |
1 |
1 |
6 |
28 to 560 |
|
Johnson et al. (2012)a |
4 |
1 |
5 |
0.6 to 140 |
|
Robinson et al. (2013)b |
6 |
3 |
8 |
0.06 to 22.7 |
|
Solomon and Bradley (2014)b |
2 |
2 |
4 |
0.028 to 28 |
|
Wax et al. (1969)a |
2 |
2 |
6 |
2.2 to 70 |
|
aStudy was included in the Egan et al. (2014) meta-analysis. bStudy was not included in the Egan et al. (2014) meta-analysis. cRobinson et al. (2013) included both height and injury data, but due to the way the data were presented in the manuscript, these data could not be used in the analysis to quantify the relationship between these variables and soybean yield. |
||||
Means from each dose-response series for each study were extracted from the published papers, and converted to percentage of control (zero-dose) values where necessary. Transforming yield data to percent of control is not ideal for individual studies, as information about the original response is lost by converting to percent-of-control; however, some studies included in the analysis presented data only in this format so it was decided to treat all data similarly. Transformation of means to relative response is a common approach in meta-analyses. Response variables included soybean injury 14 days after dicamba exposure and soybean yield at maturity. Height data was also collected, but due to variable times of measurement in the original studies (ranging from 2 weeks after treatment to maturity) analysis of height data is only presented as supplementary information (Figures S1 and S2). For each dose-response series, the soybean growth stage as reported in the original study was recorded. For analysis, the growth stages were grouped into the following categories: early vegetative (V1 to V3), late vegetative, pre-bloom (V4 to V7), flowering (R1 to R2), and pod fill (R3 to R4). If the growth stage reported in the study was a range (such as V3 to V4), then it was included in the group corresponding to the most advanced growth stage reported.
A two-parameter log-logistic model (Eq. 1) was used to quantify soybean response to dicamba dose for each study (Price et al. 2017; Seefeldt et al. 1995), where y is the response variable, x is dicamba dose, e is the dicamba dose causing 50% yield loss, and b is a parameter describing the slope at e. Equation 1 was used to quantify soybean yield and injury as a function of dicamba dose, as well as to quantify soybean yield as a function of soybean injury 14 days after dicamba exposure. For each study, a separate regression was fit to each growth stage category. If a study contained multiple dose-response series for a growth stage category, the data from those series were combined to fit a single curve for the analysis. Lack-of-fit tests and model AIC values were compared to determine whether the slope parameter could be held constant among studies within each growth stage.
![]() [1]
[1]
To determine the strength of evidence to support anecdotal reports of increased soybean yield in response to low-dose dicamba exposure, a hormesis model (Eq. 2) was fit to data from all studies (N=3) where reported yield values for any dicamba dose were greater than 102% of the control (Auch and Arnold 1978; Robinson et al. 2013; Weidenhamer 1989). The hormesis model (Cedergreen et al. 2005) is of the same form as Eq. 1, but with the addition of two parameters: f describes the magnitude of the increase in soybean yield (y) at low dicamba doses (x), and a describes the steepness of the increase, with possible values ranging from 0 to 1. When f = 0, indicating no hormesis, then Eq. 2 simplifies to Eq. 1. For model fitting, a was fixed at values of either 0.5, 0.7, or 0.9, and the model with the lowest AIC was chosen to compare with the non-normesis model. A t-test was used to compare each hormesis parameter (f) to 0, where a significant test suggests that hormesis was present. In addition, the three-parameter model and the hormesis model were compared using a lack-of-fit test, where a significant lack-of-fit test suggests the hormesis model provides a better fit to the data. If the f parameter t-test and lack-of-fit tests were both non-significant (at alpha = 10% level), then it suggests that the evidence for hormesis was not strong enough to support the claim of increased soybean yield at low doses. Conversely, if hormesis were present, it was expected that at least one test would be statistically significant.
 [2]
[2]
The dicamba dose required to cause 5% soybean yield loss (YL5) or 5% visible injury (VI5) and the 95% confidence intervals (CI) were estimated for each growth stage from each study using the ED() function from the drc package. The level of visible injury associated with a 5% soybean yield loss (I5) was also estimated using the same method.
After analyzing each study individually, data from all studies were pooled for analysis using a nonlinear mixed-effects model. Equation 1 was re-paramaterized for the pooled analysis by adding a constant (K) to the equation as suggested by Schabenberger et al. (1999):
![]() [3]
[3]
The constant K was calculated by taking the percentage response of interest (pct) and dividing it by 100-pct so that K = pct/(100-pct). The pct of interest was either 5% or 95% depending on whether the response was increasing or decreasing, respectively, so that K was equal to either 19 (95% of the control response for decreasing response variables) or 0.0526 (5% of the control response for increasing response variables). In this way, fixed effects estimates and 95% CI values could be obtained for YL5, VI5, and I5 values from the pooled data, since addition of K to the model changes the interpretation of e parameter in Equation 3 to be a direct estimate of the 5% difference from the control level. Random effects terms for b and e parameters were included to account for variation in the parameters associated with each individual study (Price et al. 2017). All analyses were done using R version 3.4.4 (R Core Team 2018). Nonlinear regression for individual studies was done using the drc package version 3.0-4 (Ritz et al. 2015), and nonlinear mixed effects models for pooled data were conducted using the nlme package version 3.1-137 (Pinheiro et al. 2018).
Results & Discussion
Dicamba Effects on Visible Soybean Injury. Some injury was observed at all non-zero doses in all studies (Table 2). Robinson et al. (2013) observed the lowest visible injury (<5%) at the 0.06 g ha-1 dose of dicamba. Three other studies applied dicamba rates less than 1 g ha-1; Johnson et al. (2012) observed >25% injury at 0.6 g ha-1, Solomon and Bradley (2014) observed at least 10% injury at 0.028 g ha-1, and Weidenhamer applied a dose of 0.04 g ha-1 but did not report visible injury. Because visible injury was reported at the lowest dicamba dose in each study where injury was evaluated, a NOED value cannot be estimated from the existing published literature.
Table 2. Visible injury from lowest-dose in each study that reported visible injury.
|
Study |
Lowest dose |
V1 to V3 |
V4 to V7 |
R1 to R2 |
|---|---|---|---|---|
|
– g ha-1 – |
————- % ————- |
|||
|
Al-Khatib and Peterson (1999) |
5.6 |
47 |
||
|
Anderson et al. (2004) |
5.6 |
42 |
||
|
Griffin et al. (2013) |
1.1 |
19 |
||
|
Griffin et al. (2013) |
4.4 |
36 |
||
|
Johnson et al. (2012) |
0.6 |
27 |
||
|
Robinson et al. (2013) |
0.06 |
3 |
3 |
1 |
|
Solomon and Bradley (2014) |
0.028 |
21 |
10 |
|
|
Soltani et al. (2016) |
0.75 |
13 |
22 |
|
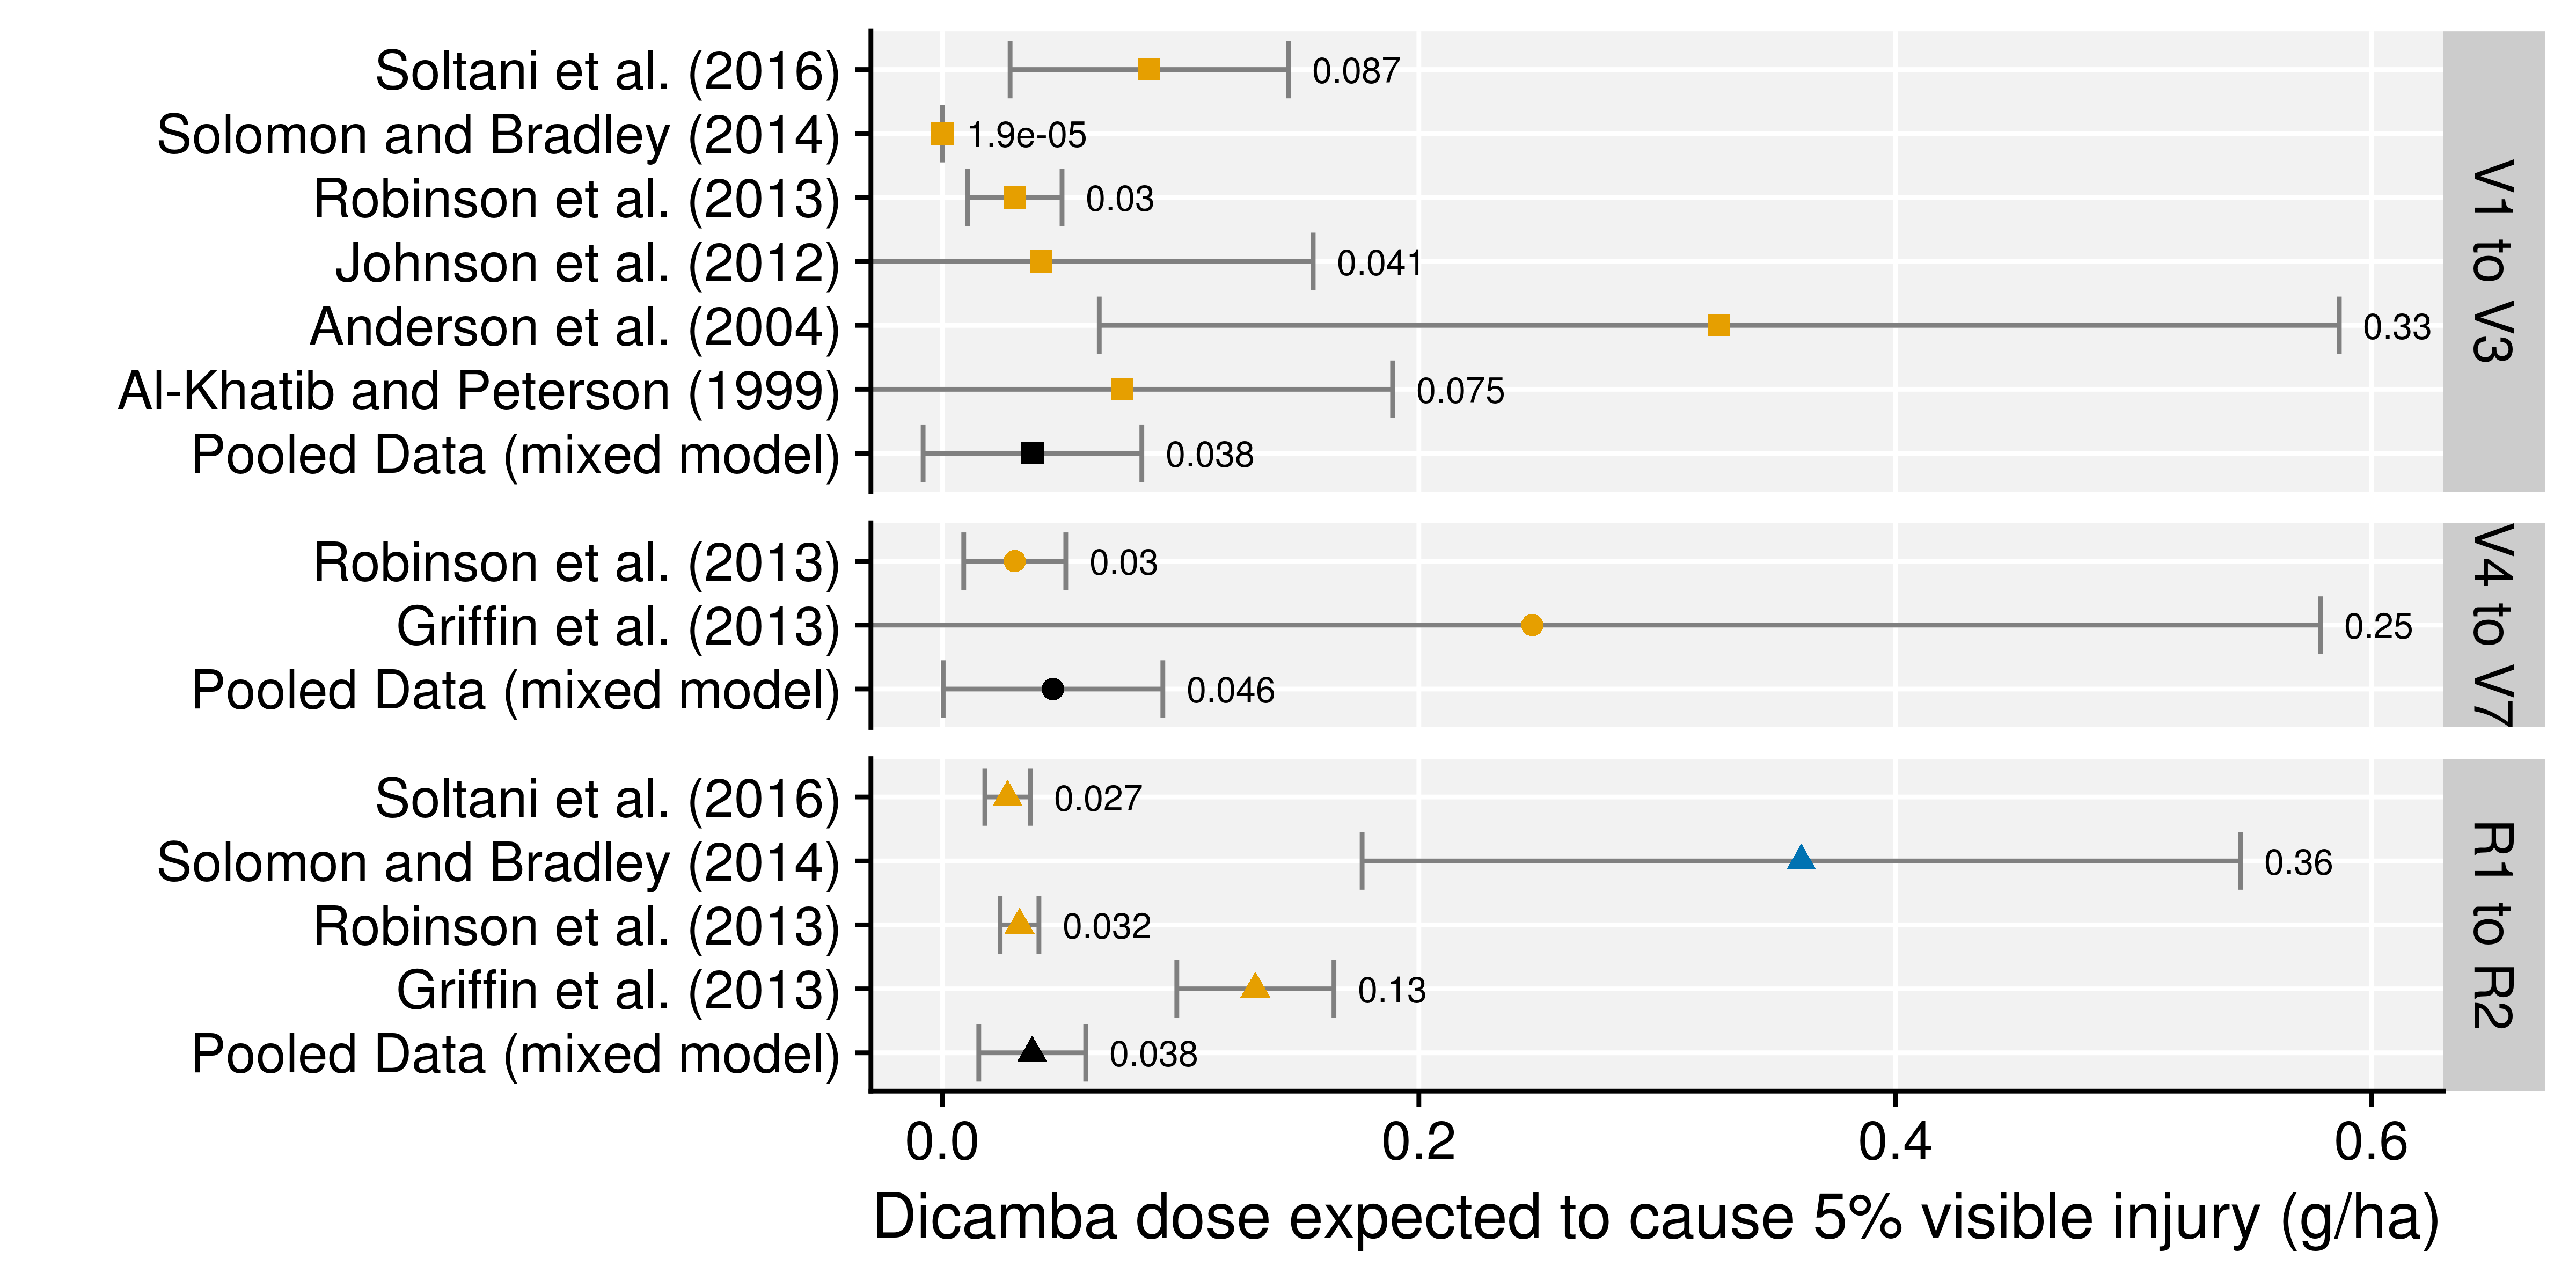
Estimating a field NOED value is important as it could help determine the amount of off-target movement of dicamba required to cause symptoms in susceptible soybean fields. A NOED value could be combined with information on volatility and other mechanisms of off-target dicamba movement to better characterize the potential for visible soybean injury and yield loss under field conditions. Since a NOED could not be estimated from the published literature, the dicamba dose expected to cause 5% visible injury (VI5) was estimated for each study and each growth stage. For all except 1 study (Solomon and Bradley 2014), the estimated VI5 was less than the lowest dose used in the study (Figure 1, Supplementary Figure S3), and therefore, these estimates should be viewed with caution. However, when data were pooled across studies, VI5 estimates for all growth stages were similar (0.038 to 0.046 g ha-1), suggesting the NOED may be in a range slightly less than the pooled estimate VI5 values. Future field research should include doses of less than 0.038 g ha-1 in order to better characterize effects of low dicamba doses on soybean.
Dicamba Effects on Soybean Yield. Hormesis. Three studies, Auch and Arnold (1978), Robinson et al. (2013), and Weidenhamer (1989), reported soybean yield greater than 102% of the non-treated control treatment, suggesting a hormesis response was possible. All three studies were analyzed to quantify the strength of evidence of a hormesis response (Supplemental Figures S4 through S6). For all three studies, the hormesis parameter f was not statistically significantly different from 0 (P>0.14). Additionally, for two of the three studies, the non-hormesis model resulted in a better model fit, as judged by AIC and lack-of-fit tests (Auch and Arnold 1978, Weidenhamer 1989). For the Robinson (2013) data, the hormesis parameter improved model fit as judged by AIC, as well as a significant lack-of-fit test; however, for this data set, the hormesis parameter was negative for 2 of three growth stages, again suggesting no evidence of hormesis. Based on the currently published information available at this time, there is insufficient evidence to support any increased soybean yield at low doses of dicamba. In order to determine if hormesis exists at doses that cause visible soybean response, future studies should include dicamba applications at much lower doses, including doses less than the (still unquantified) NOED.
Yield Reduction. Eight studies characterized soybean yield response to dicamba at the V1 to V3 stage, compared to 5 studies at the V4 to V7 stage, 7 studies at the R1 to R2 stage, and 1 study at the R3 to R4 stage. Soybean yield was modeled with a parallel slopes model for the V1 to V3 stage, but with non-parallel slopes models for the V4 to V7 and R1 to R2 growth stages (Supplementary Figure S7). YL5 values were calculated for each study for each growth stage, and these values represent an estimate of the dicamba dose at which measurable yield loss is likely to be observed (Figure 2). An observed yield reduction of less than 5% is likely to be economically important to a soybean grower; however, estimating yield losses of less than 5% would increase the uncertainty of the estimates (Price et al. 2017), and therefore, a 5% level of yield loss was chosen for this analysis.
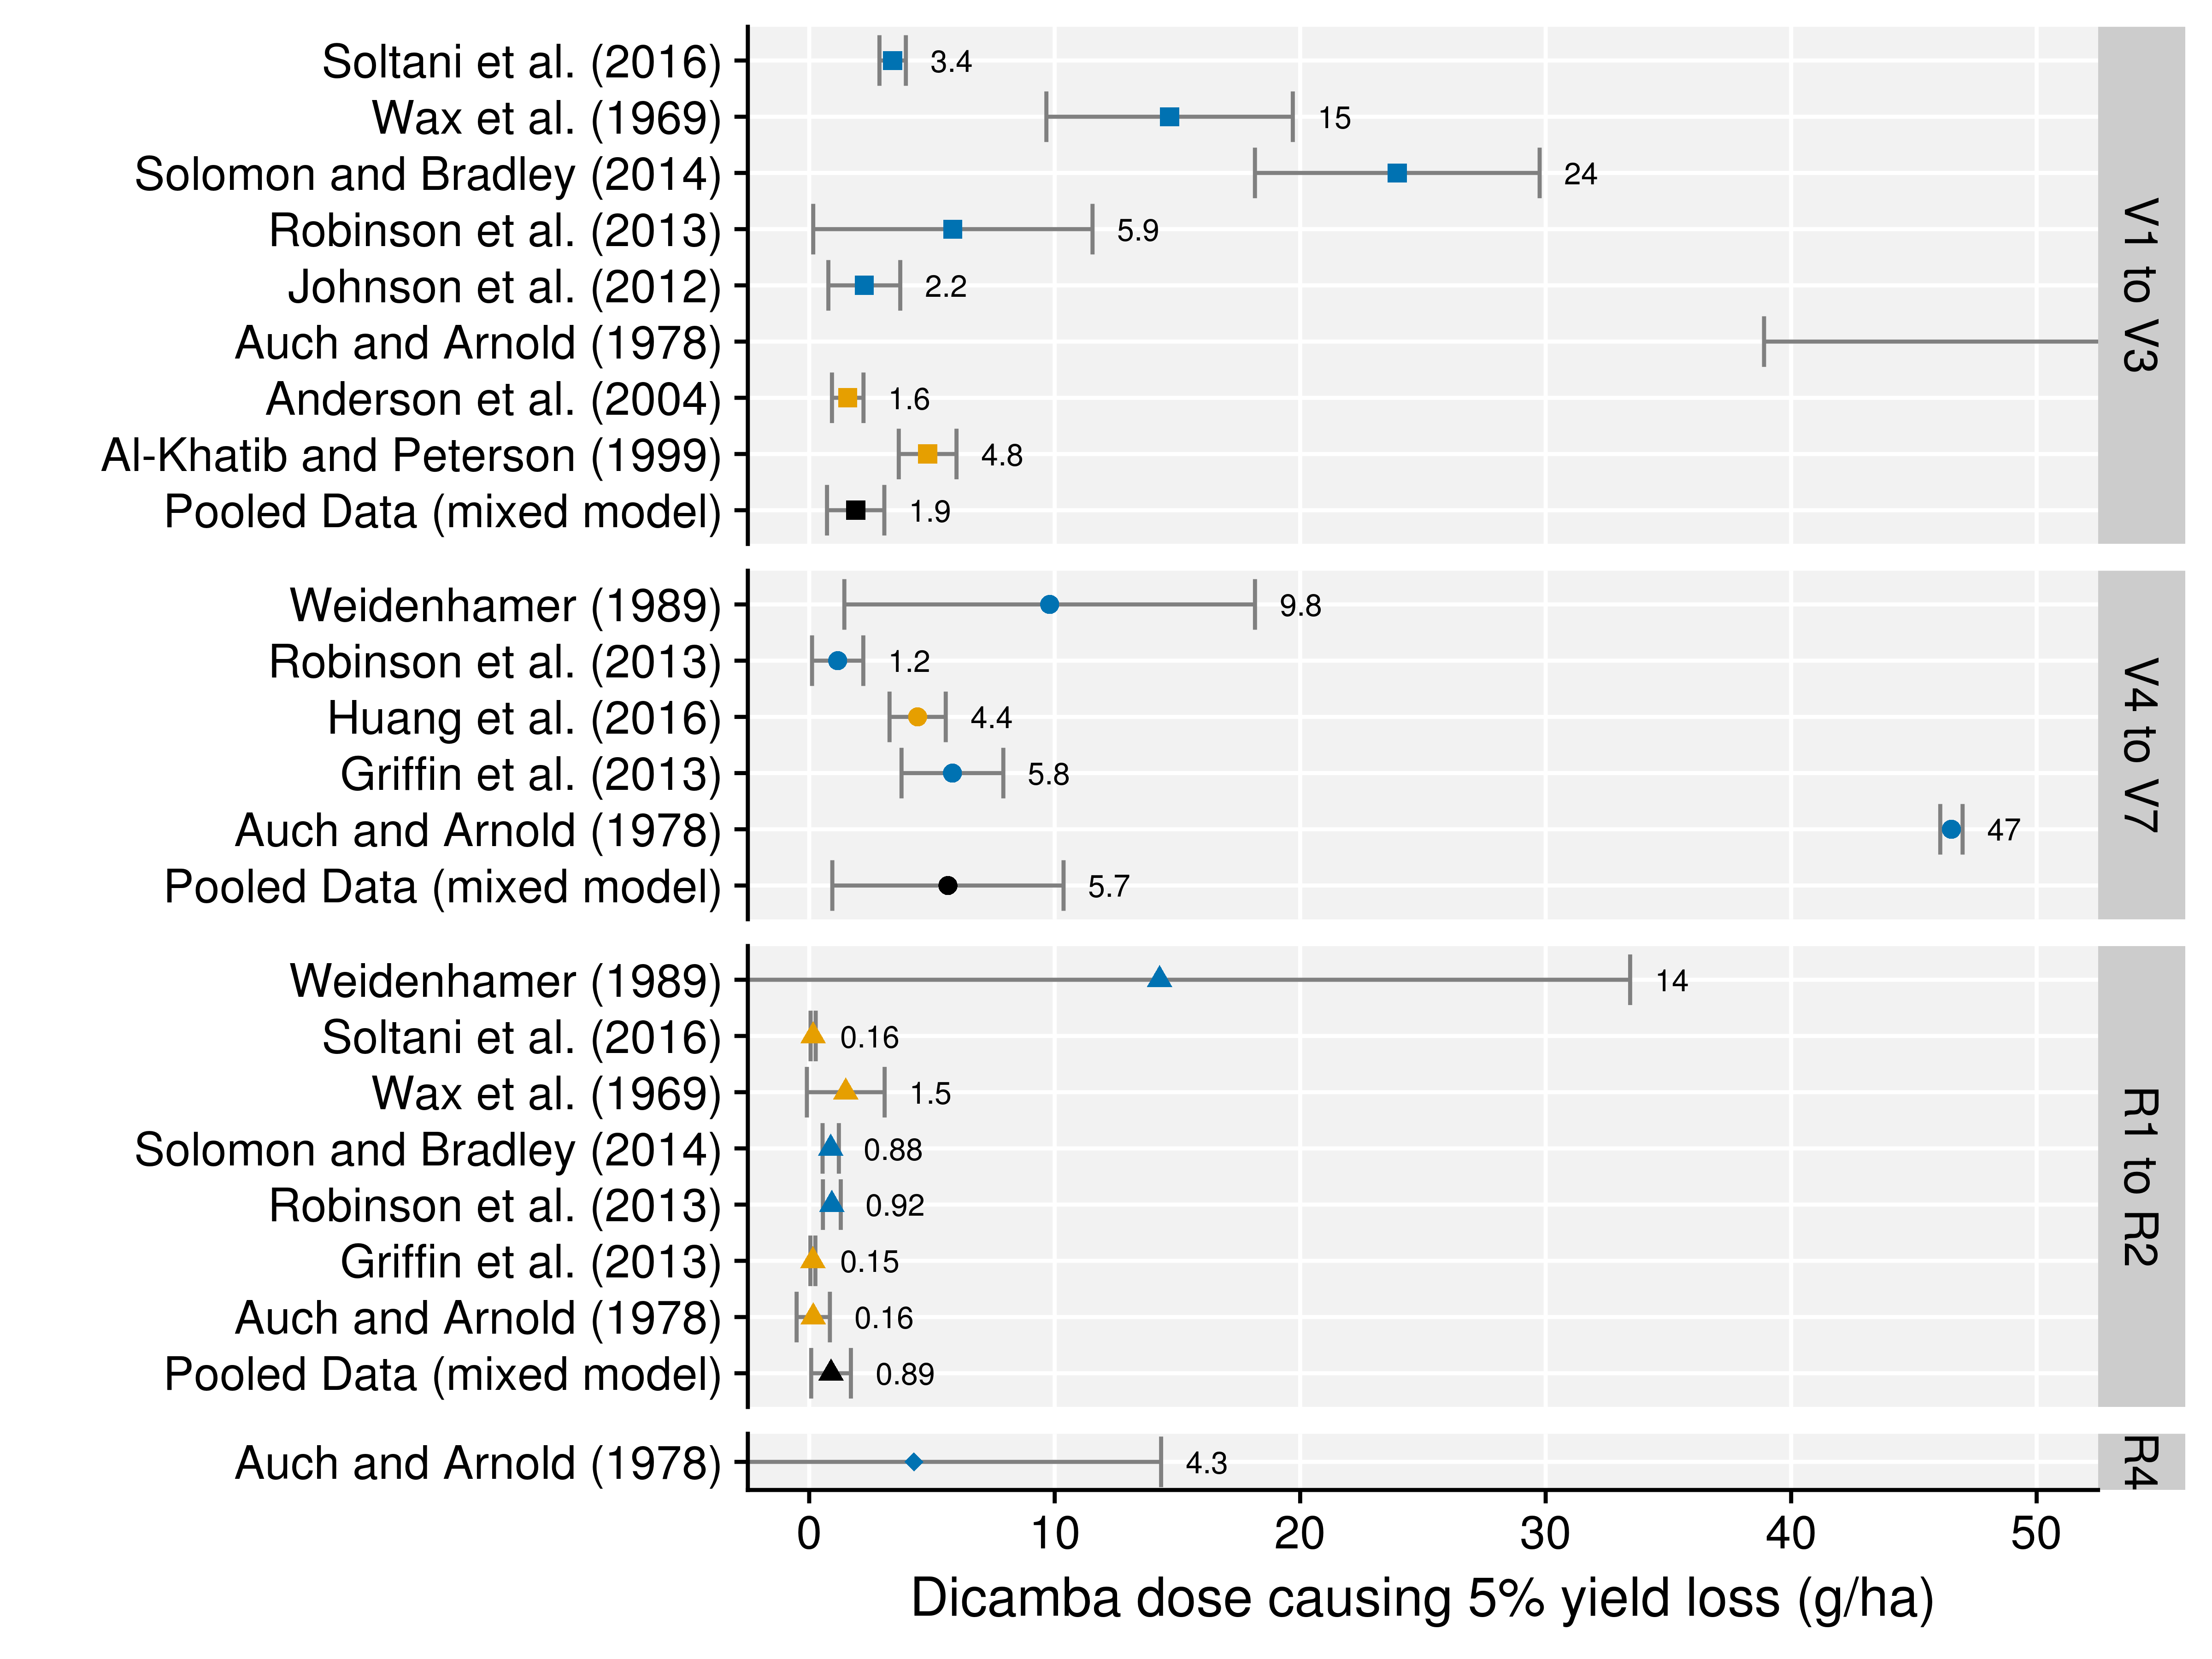
Soybean yield response to dicamba was variable across studies when exposed during the vegetative stages, with YL5 values ranging from 1.6 to 97 g ha-1 at the V1 to V3 stage, and from 1.2 to 47 g ha-1 at the V4 to V7 stage. YL5 estimates for pooled data across studies were 1.9 and 5.7 g ha-1 for early and late vegetative stages, respectively. Auch and Arnold (1978) was a notable outlier with respect to soybean yield loss in response to dicamba exposure at the vegetative stages with YL5 estimates approximately 10-times greater than other studies. This may be due to only three non-zero doses used in the study, the fewest of any study in this meta-analysis (along with Anderson et al. 2004).
These results confirm many expert opinions that yield impacts of dicamba exposure are difficult to predict when soybean is exposed during the vegetative stage. There are many factors that contribute to plant response to stress, such as precipitation, fertility, temperatures, and other factors, all of which can impact eventual yield. Optimal conditions for soybean growth are likely to mitigate yield loss in response to dicamba exposure at the vegetative stages, however, unfavorable conditions are likely to exacerbate yield loss due to dicamba. Which of these environmental factors are most important in determining soybean yield loss following dicamba exposure have not been fully characterized, and this is a potential area for future research.
Soybean in the flowering stage (R1 to R2) was consistently more sensitive to dicamba exposure compared to exposure during the vegetative stages (Figure 2). When exposed at the R1 to R2 stage, YL5 values ranged from 0.15 to 14 g ha-1 with a pooled data YL5 estimate of 0.89. Based on pooled data YL5 values, soybean is 2 to 6 times more sensitive to dicamba when exposed at the flowering stage than when exposed at the vegetative stage of growth. Soybean yield loss estimates were also more consistent across studies when exposed at the flowering stage, possibly suggesting there is less potential for soybean recovery if exposed to dicamba at this stage.
Relationship Between Visible Injury and Yield. When diagnosing dicamba injury from off-target movement events, it is nearly impossible to estimate the dose received by the injured soybean plants, especially if the off-target event is a result of volatilization and the source is unknown. The direct relationship between dicamba dose and soybean yield is, therefore, of limited value to practitioners assessing off-target complaints. However, it is common for weed scientists to quantify the severity of visible injury in these fields, and the relationship between observed injury symptoms and soybean yield loss could be of value. Several previous papers have used dose-response techniques to estimate crop yield loss as a function of visible injury observed during the vegetative stage (Egan et al. 2014; Kniss and Lyon 2011). This approach allows estimating yield loss as a function of the severity of injury symptoms, even if the herbicide dose is unknown.
The I5 values (percent injury 14 days after exposure associated with a 5% yield loss) showed a similar pattern as YL5 with respect to soybean growth stage (Figure 3). The amount of injury associated with 5% yield loss was lower when soybean was exposed at the R1 to R2 stage compared to vegetative stages. I5 values ranged from 27 to 43% when soybean was exposed during the vegetative stages (pooled data I5 = 36%, 95% CI = 23 to 50), suggesting that visible injury less than 23% is unlikely to result in severe soybean yield loss if exposed before the V4 soybean stage. However, when exposed at flowering, observed injury symptoms as low as 10% were associated with a 5% soybean yield loss (pooled data I5 = 12%, 95% CI = 8 to 16).

As previously described by Egan et al. (2014), meta-analyses can be a powerful tool to summarize similar data from diverse environments and different study designs. This analysis differs from that of Egan et al. in that random effects were included when pooling data to account for variation in parameters associated with each study. Although this approach is unlikely to dramatically change the results of the point estimates (e.g. YL5), this mixed model approach should provide a more accurate estimate of standard errors associated with those estimates, as well as the confidence intervals that are based on those standard errors.
The I5 estimates from this analysis are potentially useful to practitioners attempting to estimate yield loss in the field after an off-target movement event with unknown dose. However, the primary limitation for this use is that all of the data summarized here was a result of a single exposure of dicamba at a known time. Under field conditions, off-target movement events are not as well defined, and an exact exposure time may be difficult or impossible to estimate based solely on in-field symptom progression. In addition, off-target events due to volatilization or fine particle drift may occur multiple times, and expose susceptible soybean fields for longer duration at each event. It is currenlty unknown whether the relationship between injury symptoms and yield are similar between single vs multiple exposures that result in similar levels of visible injury. It is possible that a concentration/exposure time model similar to what is used for aquatic weed control may provide a more reliable estimate for these repeated exposure scenarios.
Acknowledgements
This research received no specific grant from any funding agency, commercial or not-for-profit sectors. Funding has been previously provided to the University of Wyoming in support of Dr. Kniss’s research and education program – through unrestricted gifts, research contracts, or grants – from the following organizations who have economic interests directly related to dicamba-resistant soybean: BASF, Bayer CropScience, DuPont, and Monsanto. None of the funding from these organizations related to the preparation of this manuscript, and no funding agency was consulted regarding this manuscript.
References
Al-Khatib, K, Peterson, D (1999) Soybean (Glycine max) Response to Simulated Drift from Selected Sulfonylurea Herbicides, Dicamba, Glyphosate, and Glufosinate. Weed Technol. 13:264-270.
Anderson, SM, Clay SA, Wrage, LJ, Mathees, D (2004) Soybean Foliage Residues of Dicamba and 2,4-D and Correlation to Application Rates and Yield. Agron. J. 96:750-760.
Auch, DE, Arnold, WE (1978) Dicamba Use and Injury on Soybeans (Glycine max) in South Dakota. Weed Sci. 26:471-475.
Bradley, KW (2017) A final report on dicamba-injured soybean acres. URL: https://ipm.missouri.edu/IPCM/2017/10/final_report_dicamba_injured_soybean/ Accessed May 20, 2018.
Cedergreen, N, Ritz, C, Streibig, JC (2005) Improved empirical models describing hormesis. Environmental Toxicology and Chemistry. 24:3166-3172.
Egan, JF, Barlow, KM, Mortensen, DA (2014) A Meta-Analysis on the Effects of 2,4-D and Dicamba Drift on Soybean and Cotton. Weed Sci. 62:193-206.
Griffin, JL, Bauerle, MJ, Stephenson III, DO, Miller, DK, Boudreaux, JM (2013) Soybean Response to Dicamba Applied at Vegetative and Reproductive Growth Stages. Weed Technol. 27:696-703.
Huang, Y, Yuan, L, Reddy, KN, Zhang, J (2016) In-situ plant hyperspectral sensing for early detection of soybean injury from dicamba. Biosyst. Eng. 149:51-59.
Johnson, VA, Fisher, LR, Jordan, DL, Edmisten, KE (2012) Cotton, Peanut, and Soybean Response to Sublethal Rates of Dicamba, Glufosinate, and 2,4-D. Weed Technol. 26:195-206.
Kniss, AR, Lyon, DJ (2011) Winter Wheat Response to Preplant Applications of Aminocyclopyrachlor. Weed Technol. 25:51-57.
Pinheiro J, Bates D, DebRoy S, Sarkar D, R Core Team (2018) nlme: Linear and Nonlinear Mixed Effects Models. R package version 3.1-137. URL: https://CRAN.R-project.org/package=nlme.
Price, WJ, Shafii, B, Seefeldt, SS (2017) Estimation of Dose-Response Models for Discrete and Continuous Data in Weed Science. Weed Technol. 26:587-601.
R Core Team (2018) R: A language and environment for statistical computing. R Foundation for Statistical Computing, Vienna, Austria. URL: https://www.R-project.org/.
Ritz, C, Baty, F, Streibig, JC, Gerhard, D (2015) Dose-Response Analysis Using R PLOS ONE. 10(12):e0146021.
Robinson, AP, Simpson, DM, Johnson, WG (2013) Response of Glyphosate-Tolerant Soybean Yield Components to Dicamba Exposure. Weed Sci. 61:526-536.
Schabenberger, O, Tharp, BE, Kells, JJ, Penner, D (1999) Statistical Tests for Hormesis and Effective Dosages in Herbicide Dose Response. Agron. J. 91:713-721.
Seefeldt, SS, Jensen, JE, Fuerst, EP (1995) Log-Logistic Analysis of Herbicide Dose-Response Relationships. Weed Technol. 9:218-227.
Solomon, CB, Bradley, KW (2014) Influence of Application Timings and Sublethal Rates of Synthetic Auxin Herbicides on Soybean. Weed Technol. 28:454-464.
Soltani, N, Nurse, RE, Sikkema, PH (2016) Response of glyphosate-resistant soybean to dicamba spray tank contamination during vegetative and reproductive growth stages. Can. J. Plant Sci. 96:160-164.
USDA-NASS (2017) Quick Stats. URL: https://quickstats.nass.usda.gov/ Accessed May 20, 2018.
Wax, LM, Knuth, LA, Slife, FW (1969) Response of Soybeans to 2,4-D, Dicamba, and Picloram. Weed Sci. 17:388-393.
Weidenhamer, JD, Triplett, GB, Sobotka, FE (1989) Dicamba Injury to Soybeans. Agron. J. 81:637-643.
