This post is probably more technical than most that I write, but it is something that I think needs to be written. I actually debated submitting a short article to a peer reviewed journal, but really didn’t want to wait the months to a year that would require before it saw the light of day. So I’m putting the nuts and bolts here, and perhaps someday I’ll submit some version of this analysis to a journal where “serious academics” can read it.
The Environmental Impact Quotient (EIQ) proposed by Kovach et al. (1992) has been vigorously criticized in the literature, most notably by Dushoff et al. (1994) and Peterson and Schleier (2014). We recently analyzed the suitability of the EIQ specifically for comparing herbicides (Kniss and Coburn 2015), and found deep flaws in this environmental index. Due to a variety of problems, the EIQ is simply unsuitable for comparing pesticides. Many of the flaws embedded in the EIQ are summarized in a previous blog post.
Even after many attempts to point out the flaws in the EIQ and discourage it’s continued use, the EIQ continues to be used in the peer-reviewed literature, as recently as last week. In the most recent use of the EIQ, the study authors simply dismissed the fundamental flaws in the EIQ with a three-word statement: “Despite certain shortcomings…” This, in my opinion, is almost like saying that “despite certain shortcomings” in the flat-earth theory, I have decided to base some new scientific conclusions on the premise that the earth is indeed flat. If you are going to base conclusions of a scientific paper on an environmental metric, you really need to address the serious flaws that metric brings to bear on your analysis. The flaws in the EIQ are so fundamental, they should not be easily dismissed or glossed over. I’ve written extensively about that here and here, but I’m afraid that because the EIQ has been used so regularly over the years, reviewers and editors are now willing to look past the severe problems in the EIQ.
It seems that no matter how rigorously the EIQ is criticized, many scientists feel that, “Well, the EIQ is still better than nothing.” I’ve received some version of this response nearly every time I discuss the problems with the EIQ. And every time I hear this response, I wonder whether it’s actually true. So, I decided to finally answer this question.
Is the EIQ better than nothing?
The EIQ was developed as a method to compare pesticides. The following example is provided in the original article:
| Material | Rate | ai | EIQ | Field EIQ |
| Sevin 50WP (carbaryl) | 6.0 | 0.5 | 22.6 | 67.8 |
| Thiodan 50WP (endosulfan) | 3.0 | 0.5 | 40.5 | 60.8 |
| Guthion 35WP (azinophos-methyl) | 2.2 | 0.35 | 43.1 | 33.2 |
In a nutshell, each pesticide is assigned an EIQ value based on a variety of toxicity and exposure characteristics. That EIQ value is multiplied by the pesticide use rate, and the resulting EIQ Field Use Rating is used to compare which pesticide is the least toxic choice. The paper suggests that because azinphos-methyl has the lowest EIQ Field Use Rating, it “would be the least toxic choice” of the three pesticides in the list.
To determine if the EIQ is actually better than nothing, I decided to compare the EIQ with a second index that I made up, named the Randomly Generated Index, or RGI. To create the RGI, I literally used a set of randomly chosen values, and plugged those randomly chosen values into the EIQ formula. The resulting RGI value is completely meaningless; it provides absolutely no useful information since all of the data used to generate it was randomly selected. The RGI is my attempt at creating an index that literally tells us nothing. I then compared the EIQ with the RGI, to see if the EIQ is, in fact, better than nothing.
To compare the EIQ with my randomly generated RGI, I used the process as that suggested in the original EIQ paper, and then did the same thing with the RGI to calculate the RGI Field Use Rating. So using two of the pesticides from example above, my approach basically looks like this:
| Material | Rate | ai | EIQ | Field EIQ | RGI | Field RGI |
| Thiodan 50WP (endosulfan) | 3.0 | 0.5 | 40.5 | 60.8 | 51.3 | 77.0 |
| Guthion 35WP (azinophos-methyl) | 2.2 | 0.35 | 43.1 | 33.2 | 26.7 | 20.1 |
The EIQ and the RGI lead to the same conclusion in this comparison: azinphos-methyl is the least toxic option. But because the RGI is randomly generated, we should expect that the RGI could have just as easily changed the rankings and pointed to the opposite conclusion. Because the RGI is a randomly chosen version of the EIQ, the RGI and the EIQ should give the same ranking approximately 50% of the time if we compare 2 randomly selected pesticides. But to determine how the EIQ compares with randomly generated values, we can’t do this just once or twice, we need to make these comparisons many, many times.
To make a large number of comparisons, I used two herbicide data sets that we used in our recent quantitative analysis of the EIQ. For each herbicide, I calculated the EIQ Field Use Rating (which I’ll call the Field EIQ for short), and then I did the same with the RGI using the following process (all steps below were repeated 1,000 times for 2 different data sets):
- Create a randomly generated index (RGI) value for each herbicide by plugging random risk values into the EIQ formula.
- Multiply the RGI by the herbicide use rate to determine the RGI Field Use Rating (or Field RGI for short)
- Choose two herbicides, and compare their Field EIQ values to determine which is lower (which is supposed to mean less toxic).
- Compare the same two herbicides using the Field RGI to determine which is lower.
- Determine if the Field EIQ and Field RGI lead to the same conclusion about which herbicide is less toxic.
- Repeat the steps above for all pairs of herbicides in the data set.
- Calculate how often the EIQ and RGI chose the same herbicide as “better” for each pairwise comparison.
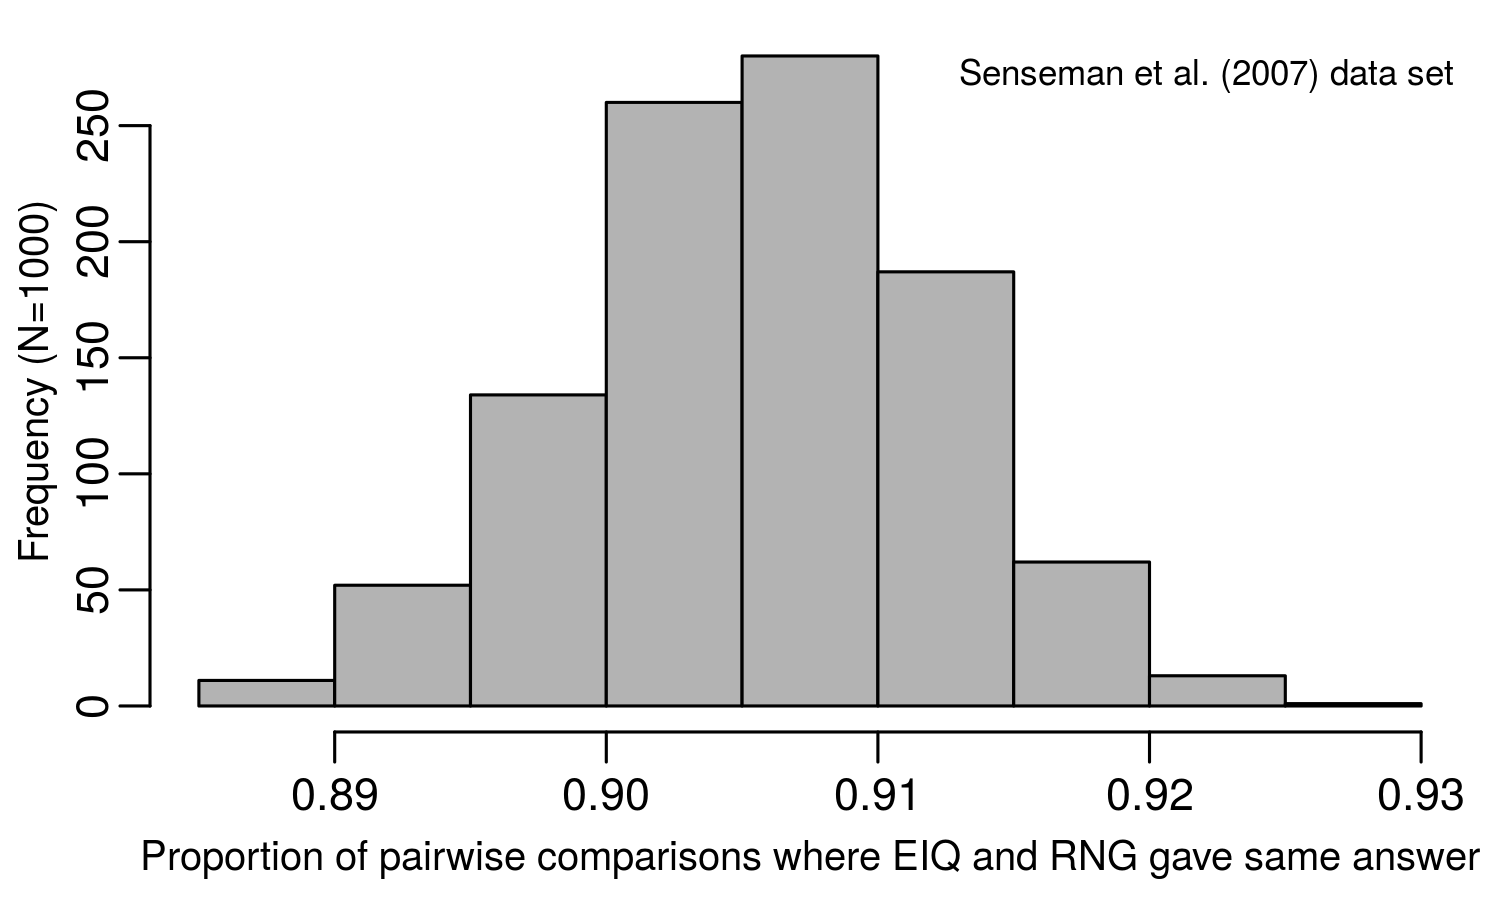
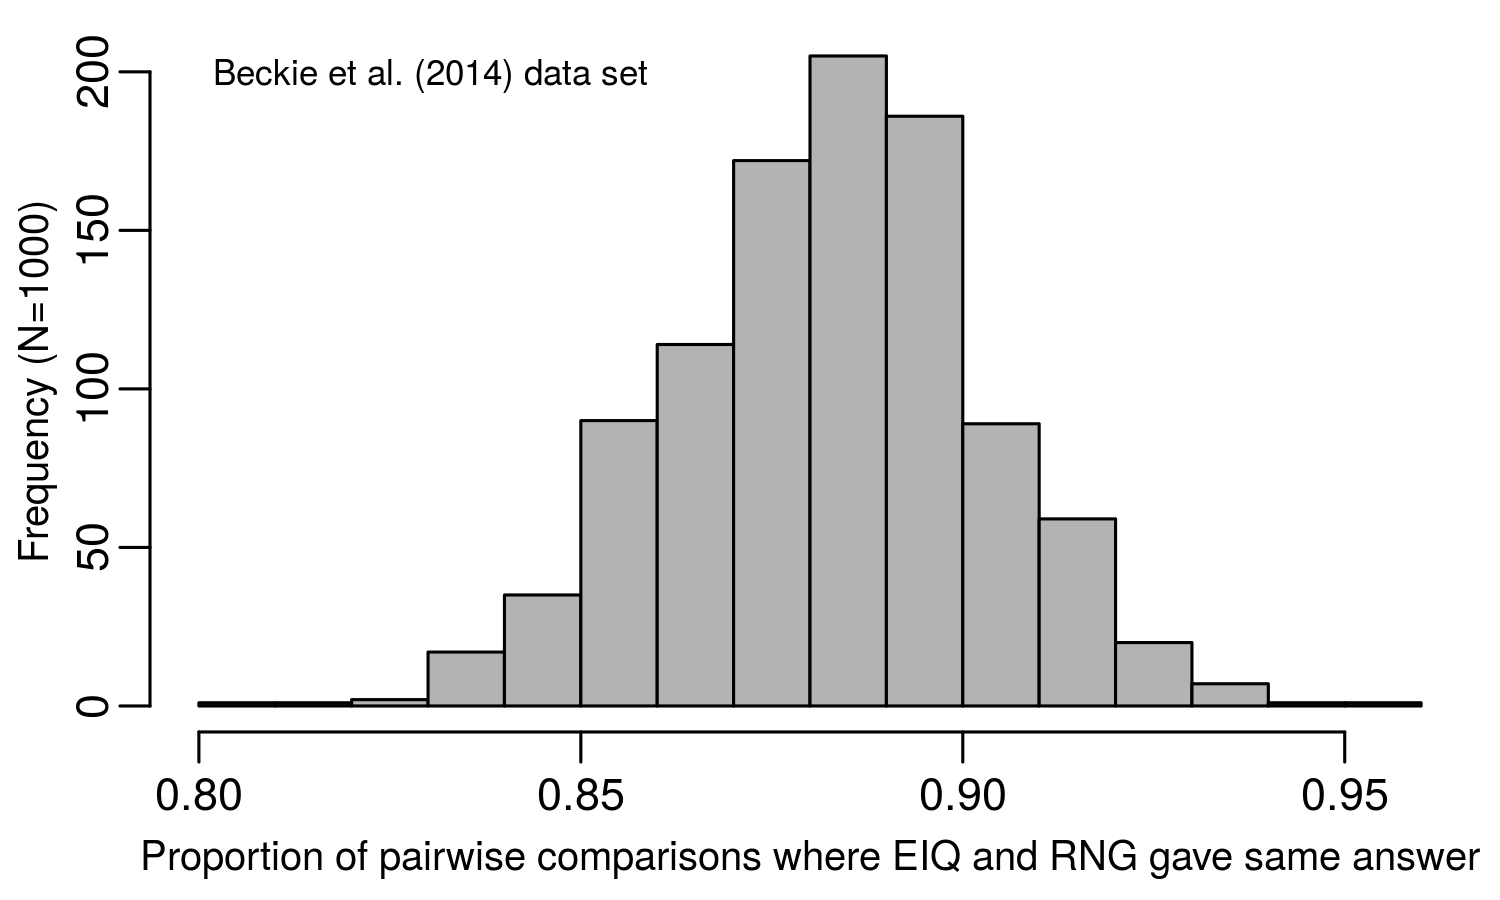
The larger of the two data sets I used has 119 herbicides in it, meaning that if we compare Herbicide A with Herbicide B, then Herbicide A with Herbicide C, then keep going until all possible pairs of herbicides were compared, there are a total of 7,021 comparisons to be made. So in one run of the simulation, I created an RGI value for each herbicide, made all 7,021 comparisons with both the EIQ and the RGI, then calculated how many of those comparisons were the same between the two indices. Since the RGI is based on random values and is meaningless, it should match the EIQ recommendation about half the time since in each comparison we only have two choices, Herbicide A or Herbicide B. I then repeated that process 999 more times, each time calculating what proportion of pairwise comparisons the EIQ and RGI provided the same conclusion. Then I repeated the entire process for a smaller data set that has 28 different herbicides (making 378 comparisons per run, also with 1,000 runs). So in total, I made 73,399,000 pairwise comparisons. (Well, let’s be honest, the computer actually made the comparisons, I just wrote a little script to tell the computer what to do…)
Results:
Using the data set containing 119 different herbicides (Senseman data set), the randomly generated RGI index provided the same conclusion as the EIQ 91% of the time. In fact, after drawing random numbers for the RGI 1,000 times, the EIQ and RGI never differed by more than 12% in any of the simulation runs. Looking at a smaller (but probably more realistic) data set (Beckie data set), the results were very similar. The RGI provided the same recommendation as the EIQ about 88% of the time, but ranged from 81 to 95%, depending on the simulation run.
But how can this be true? The RGI is, by definition, meaningless, but the EIQ incorporates a lot of data. So how is a randomly assigned number containing no useful information giving the same conclusion as the EIQ 90% of the time?
The answer to this question was actually described by Dushoff et al. in the very first formal critique of the EIQ, published only two years after the EIQ was proposed. From that article (emphasis mine):
“For the approach used in EIQ to be meaningful, it is necessary that the values obtained for each pesticide have actual quantitative meanings – that is, a pesticide that has an EIQ of 100 should be in some quantitative sense twice as bad as one that has an EIQ of 50, and two units of the latter should have the same effect as one of the former. In fact, the inputs to EIQ formula are all translated arbitrarily to a scale from one to five and, thus, do not have direct quantitative meaning.”
This lack of quantitative meaning in the EIQ makes multiplying it by the pesticide use rate to derive a Field EIQ nonsensical in most cases. It also explains why many critics of the EIQ have found that the Field EIQ is primarily driven by the field use rate of the pesticide, with very little contribution of the EIQ value of the pesticide. This makes the EIQ, at best, a minimal improvement over simply reporting the weight of pesticide applied. But as I have just shown, a random number generator can provide similar results as the EIQ, meaning the EIQ is not an improvement at all. When pesticide rates vary by orders of magnitude (grams vs kilograms per hectare), the relatively small differences in the EIQ values (or randomly chosen RGI values) won’t change the ranking between pesticides in many cases. The Field EIQ is heavily biased by the field use rate of the pesticide, which means the EIQ provides no improvement over the problem it is purported to solve.
Add to this problem that we found that over 25% of the EIQ value for herbicides results from a risk factor that has no consistent or quantifiable impact on risk, and it is quite possible that a randomly generated RGI value may even provide a better estimate of risk in some cases.
So please, stop using the EIQ. It turns out the EIQ actually isn’t better than nothing.
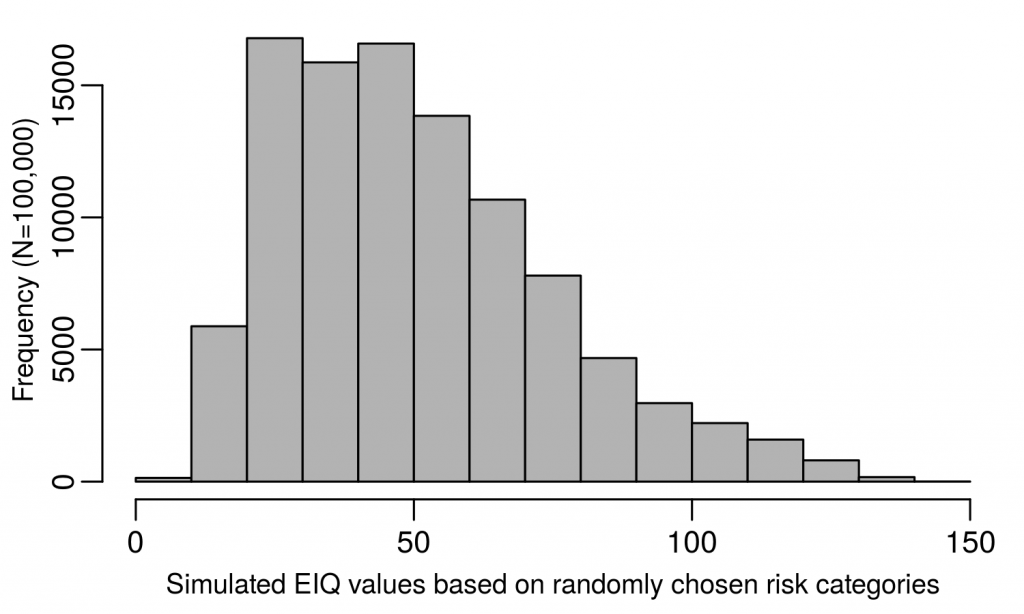
UPDATE: Some additional details on the methods for choosing the RGI values:
I followed the methods described in our PLOS ONE paper (section “sensitivity analysis” to create 100,000 meaningless EIQ-like values, then randomly selected a value from that set as the RGI to assign to each herbicide for each run of the simulation. The distribution of values from which I randomly selected each RGI is below.