Another interesting article about GMOs has been making the rounds today. This one was written by Dr. Charles Benbrook, Chief Science Consultant for The Organic Center. This publication is an updated version of a report that The Organic Center published in 2009. The new version has been published in “Environmental Sciences Europe” and can be downloaded here for free (hooray for open access!). The title of the article is “Impacts of genetically engineered crops on pesticide use in the U.S. — the first sixteen years”. The following excerpt from the abstract provides a pretty good summary of Dr. Benbrook’s analysis:
A model was developed to quantify by crop and year the impacts of six major transgenic pest-management traits on pesticide use in the U.S. over the 16-year period, 1996–2011: herbicide-resistant corn, soybeans, and cotton; Bacillus thuringiensis (Bt) corn targeting the European corn borer; Bt corn for corn rootworms; and Bt cotton for Lepidopteron insects.
Herbicide-resistant crop technology has led to a 239 million kilogram (527 million pound) increase in herbicide use in the United States between 1996 and 2011, while Bt crops have reduced insecticide applications by 56 million kilograms (123 million pounds). Overall, pesticide use increased by an estimated 183 million kgs (404 million pounds), or about 7%.
Contrary to often-repeated claims that today’s genetically-engineered crops have, and are reducing pesticide use, the spread of glyphosate-resistant weeds in herbicide-resistant weed management systems has brought about substantial increases in the number and volume of herbicides applied.
Reuters recently reported on the article (pretty uncritically you might notice). And that article has been re-printed (also uncritically) in several other online news outlets. I’m not going to address the point that lumping all pesticides together while ignoring toxicity doesn’t make much sense… others I’m sure will address that. I reviewed Dr. Benbrook’s previous report (after 13 years) a couple years ago, so I was already somewhat familiar with the methodology he used. Which is good, because the “Methods” section of this most recent paper on estimating herbicide use is pretty sparse (and confusing). Basically, Dr. Benbrook uses USDA-NASS data to estimate herbicide use on both conventional and herbicide resistant crop acres. This is no easy task for several reasons. First, USDA (presumably due to budget cuts) does not collect pesticide use data very often anymore. They had completely stopped for a while, and I believe are now starting again, but in a limited capacity (not all crops in all years). I agree with Dr. Benbrook that this lack of independent pesticide use data is very frustrating.
UPDATE: October 3, 2012. I have recently been reminded that USDA-NASS is not the only source of pesticide use data. There are companies that collect this information and will make it available. However, these companies also charge for use of this data. So while the data have similar (or possibly better) accuracy compared to government statistics, they will cost money to obtain.
Dr. Benbrook acknowledges a second hurdle in estimating herbicide use on conventional and herbicide resistant acres:
NASS surveys do not report pesticide use on GE and conventional crop hectares separately.
Dr. Benbrook devised a way to get around that, but I honestly still can’t quite figure out how he did that… Here’s his description if you want to try and follow it:
The volume of herbicides applied to HR hectares can be approximated by adding NASS reported glyphosate use per crop year to an estimate of the volume of herbicides other than glyphosate (hereafter, “other herbicides”) applied on HR hectares. The volume of “other herbicides” applied on HR hectares is estimated based on the average number of nonglyphosate herbicides applied per hectare, coupled with the average rate per application of non-glyphosate herbicides. In addition, the rate of “other herbicides” on HR hectares is adjusted to reflect changes from year to year in overall herbicide use and glyphosate application rates. For example in recent years, “other herbicides” have been applied to around one-half of HR soybean hectares at an average rate of ~0.34 kgs/ha (~0.3 pounds/acre), resulting in an average ~0.17 kgs/ha (~0.15 pounds/acre) of “other herbicide” applications on all HR hectares (0.5 x 0.34).
I decided to take a look at the data that Dr. Benbrook used to come to his conclusions. To his credit, he has provided the data he used as a supplemental file, linked at the end of the manuscript. The MS Excel file can be downloaded from here. The first worksheet in that Excel file is titled “Sup Tab 1 Herb Rates” and contains herbicide applications per acre for the period 1995 through 2011. It appears to be a mostly complete data set, but some very important information is in the footnotes:
1) The average rate per treated acre for total herbicides and all glyphosates applied to corn, are supplied by NASS (italicized), with the exception for the years 2004, 2006-2009 which are interpolated. 2011 is forecasted with a 2.5% increase for glyphoste and a 2% increase for total herbicides.
2) The average rate per treated acre for total herbicides and all glyphosates applied to soybeans are supplied by NASS (italicized), with the exception of 2003 which is interpolated. Total herbicides applied for the years 2004 – 2011 are forcasted at a rate of 3% increase per year. Glyphosate applied for 2007-2009 are forecasted at a 3% rate increase per year, then 2% and 4.4% for 2010 and 2011 respectively.
3) The average rate per treated acre for total herbicides and all glyphosates applied to cotton are supplied by NASS (italicized), with the exception of the years 2002, 2004, 2006 and 2009 which are interpolated. Total herbicides applied for 2011 is forcasted at an increased rate of 2.0%. Glyphosate applied for 2011 is forecasted to increase by 1%.
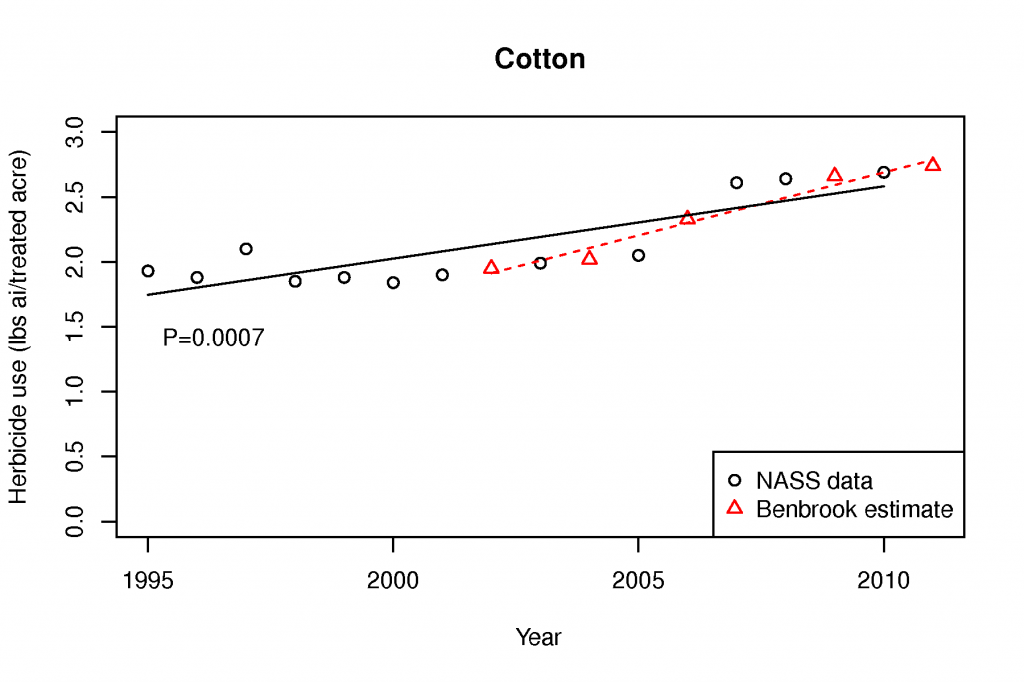
So basically, Dr. Benbrook is saying he did not have NASS data for 2004, 2006, 2007, 2008, 2009, or 2011 for corn, and instead “interpolated” or “forecasted” values for those years. For soybean, he forecasted all data after 2006 (since no NASS data were available). Cotton had the most complete data set, only missing 2002, 2004, 2006, 2009, and 2011. I’m not opposed to interpolating or forecasting data when observed data aren’t available. That’s life. But I think when data are estimated instead of observed, it is fair to question how those estimates were derived. Let’s first take a look at the cotton data, since it is the most complete data set from NASS. Below I’ve plotted the actual NASS data in black, and a linear regression line through those data. If I were going to interpolate or forecast, this would be how I would do it. I would determine if there is a trend, and use the trendline to estimate points where data is not available. This smooths out any year-to-year variability (due to wet spring weather, drought, or other factors that influence weed management). The P-value for the regression line is in the plot for any stats folks who are interested.
Although Dr. Benbrook’s estimates (in red triangles) don’t fall on my regression line, I think his estimates seem reasonable for total herbicide use in cotton. My forecasted estimate for 2011 herbicide use on cotton would be pretty similar to what Dr. Benbrook came up with using different methods. So there does appear to be an increase in the total amount of herbicide applied to cotton acres in the US between 1995 and 2011.
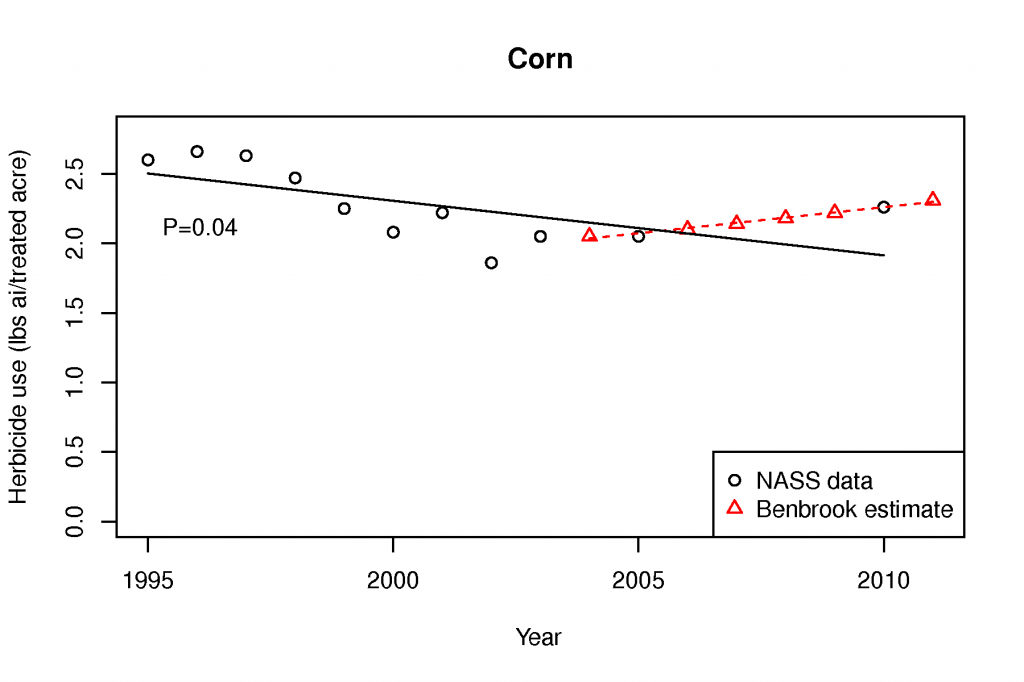
For corn, we came up with a little bit bigger differences, though. If I plot the NASS data and run a regression for total herbicide use in corn, I get a downward trend (0.039 lbs ai/treated acre per year to be exact). Dr. Benbrook, on the other hand, assumes a mostly linear increase between 2005 and 2010, and extends that increase through 2011.
So I would make the assumption that 2010 herbicide use was slightly above the predicted value (again, due to year-to-year variability) of the regression line, but we’re still observing an overall downward trend in herbicide use per acre over the period. Because that is the conclusion the observed data will support. I suppose I wouldn’t disagree too strongly with Dr. Benbrook’s estaimates here, although I would argue that using my downward trend, or even no trend between 2000 and 2011 would probably be more justifiable than the steady increase he predicts.
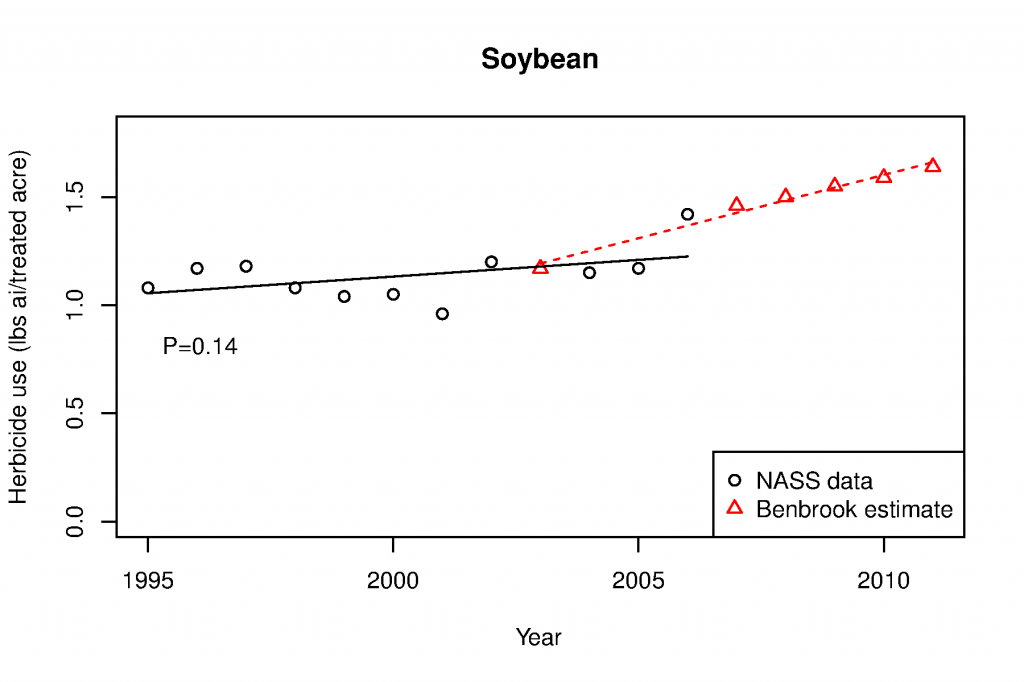
But now take a look at the soybean data. This is the most incomplete data set from NASS, and Dr. Benbrook had to forecast ALL pesticide use data between 2007 and 2011. It has been a while since I’ve been in time-series statistics class, but I’m pretty sure forecasting 5 years of data based on only 11 years of observed data is frowned upon.
Dr. Benbrook states in his article (I’d provide a page number, but there are none on the PDF):
In terms of overall herbicide use per hectare based on NASS data, substantial increases have occurred from 1996 through 2011.
and:
Compared to herbicide use rates per hectare on non-HR hectares, HR crops increased herbicide use in the U.S. by an estimated 239 million kgs (527 million pounds) in the 1996–2011 period, with HR soybeans accounting for 70% of the total increase across the three HR crops.
First, based on actual NASS data, herbicide use between 1995 and 2006 showed no statistical trend either upward or downward for soybean herbicide use (the slope of the non-significant trend line is slightly positive). But for some reason, Dr. Benbrook forecasts an unprecedented increase in total herbicide use in soybean. He assumes that the increased use in 2006 is the new normal, instead of more variation around mean. There was very little in the previous 10 years of actual soybean herbicide use data (1995 through 2006) to support Dr. Benbrook’s predicted increase in herbicide use. Dr. Benbrook then states that his “modeled” data on soybean herbicide use actually accounts for a whopping 70% of the total increase across the three crops. Let’s assume that Dr. Benbrook is is correct about cotton herbicide use (he’s probably pretty close). Let’s also give him the benefit of the doubt about corn use, even though he turned a downward trend into an increasing trend. Using his own estimate, 70% of his estimated increase in herbicide use is based on this extrapolated soybean data, that are not well supported by actual USDA data. If anyone has a link to some actual herbicide use data for soybean for the period 2007 to 2011, I’d be more than happy to update the analysis to include those numbers. Until then, I have some pretty strong questions about the “model” Dr. Benbrook used to estimate herbicide usage on these crops.


Comments are closed.